Ratio analysis
Calculate and interpret liquidity, profitability, efficiency and leverage ratios from one set of financial statements.
- Principles:
- Consistency
- Comparability
- Materiality
Why ratios
A ratio turns two numbers into one comparison that works at any size. Ratios are most useful when you compare a business with itself over time, or with others in the same industry.
All examples here use Evergreen's statements from lessons 4.1 to 4.3: revenue $360,000, COGS $144,000, net income $44,000; total assets $105,000 at the start and $136,000 at the end; equity $86,000 and $100,000; current assets $96,400 and current liabilities $27,000 at year end.
Liquidity: can it pay its bills?
The current ratio compares current assets with current liabilities. The quick ratio (acid-test) counts only cash and receivables, leaving out items like prepaid expenses and inventory that can't quickly pay a bill.
Evergreen: current ratio = $96,400 ÷ $27,000 = 3.57. Quick ratio = ($54,000 cash + $40,000 receivables) ÷ $27,000 = 3.48. Both mean current assets cover short-term debts more than three times over. A very high ratio can also mean idle cash; what's normal depends on the industry.
Current ratio = Current assets ÷ Current liabilities; Quick ratio = (Cash + Short-term investments + Receivables) ÷ Current liabilities
Profitability: does it earn enough?
Margins compare profit with revenue. Return on assets (ROA) and return on equity (ROE) compare profit with what was invested. Use the average of beginning and ending balances, because net income was earned across the whole year.
Average total assets = ($105,000 + $136,000) ÷ 2 = $120,500. Average equity = ($86,000 + $100,000) ÷ 2 = $93,000.
Note that Evergreen's owner is paid through draws, not wages, so the owner's own labor isn't an expense. That makes net margin, ROA and ROE look higher than they would for a business that pays a manager.
Gross margin = Gross profit ÷ Revenue; Net margin = Net income ÷ Revenue; ROA = Net income ÷ Average total assets; ROE = Net income ÷ Average equity
Efficiency: how fast do assets turn?
Accounts receivable turnover shows how many times a year receivables are collected. Use credit sales; Evergreen invoices all its work, so credit sales equal revenue. Average AR = ($32,000 + $40,000) ÷ 2 = $36,000. Turnover = $360,000 ÷ $36,000 = 10.0 times. Days sales outstanding (DSO) = 365 ÷ 10.0 = 36.5 days, close to Evergreen's 30-day terms.
Inventory turnover shows how often inventory is used and replaced. Evergreen buys plants for each job, so its books have no inventory account. As a what-if: if it kept a plant yard with $10,000 of stock at the start and $14,000 at the end, average inventory would be $12,000 and turnover on $90,000 of Plants & Materials would be $90,000 ÷ $12,000 = 7.5 times, or about 48.7 days (365 ÷ 7.5).
Leah Books' ratio report calculates DSO from ending receivables and the last 90 days of sales, so its number will differ from an annual average. Know which version you are looking at.
AR turnover = Net credit sales ÷ Average AR; DSO = 365 ÷ AR turnover; Inventory turnover = COGS ÷ Average inventory
Leverage: how much is borrowed?
Debt-to-equity compares what the business owes with what the owner has in it. Evergreen: $36,000 total liabilities ÷ $100,000 equity = 0.36. Some analysts use only interest-bearing debt: $12,000 loan ÷ $100,000 = 0.12. Say which one you use.
Higher leverage can raise ROE in good years and increase risk in bad ones, because loan payments are due either way.
Debt-to-equity = Total liabilities ÷ Total equity
Evergreen's ratios at a glance
| Ratio | Calculation | Result |
|---|---|---|
| Current ratio | $96,400 ÷ $27,000 | 3.57 |
| Quick ratio | $94,000 ÷ $27,000 | 3.48 |
| Gross margin | $216,000 ÷ $360,000 | 60.0% |
| Net margin | $44,000 ÷ $360,000 | 12.2% |
| Return on assets | $44,000 ÷ $120,500 | 36.5% |
| Return on equity | $44,000 ÷ $93,000 | 47.3% |
| AR turnover | $360,000 ÷ $36,000 | 10.0 times |
| Days sales outstanding | 365 ÷ 10.0 | 36.5 days |
| Inventory turnover (what-if) | $90,000 ÷ $12,000 | 7.5 times |
| Debt-to-equity | $36,000 ÷ $100,000 | 0.36 |
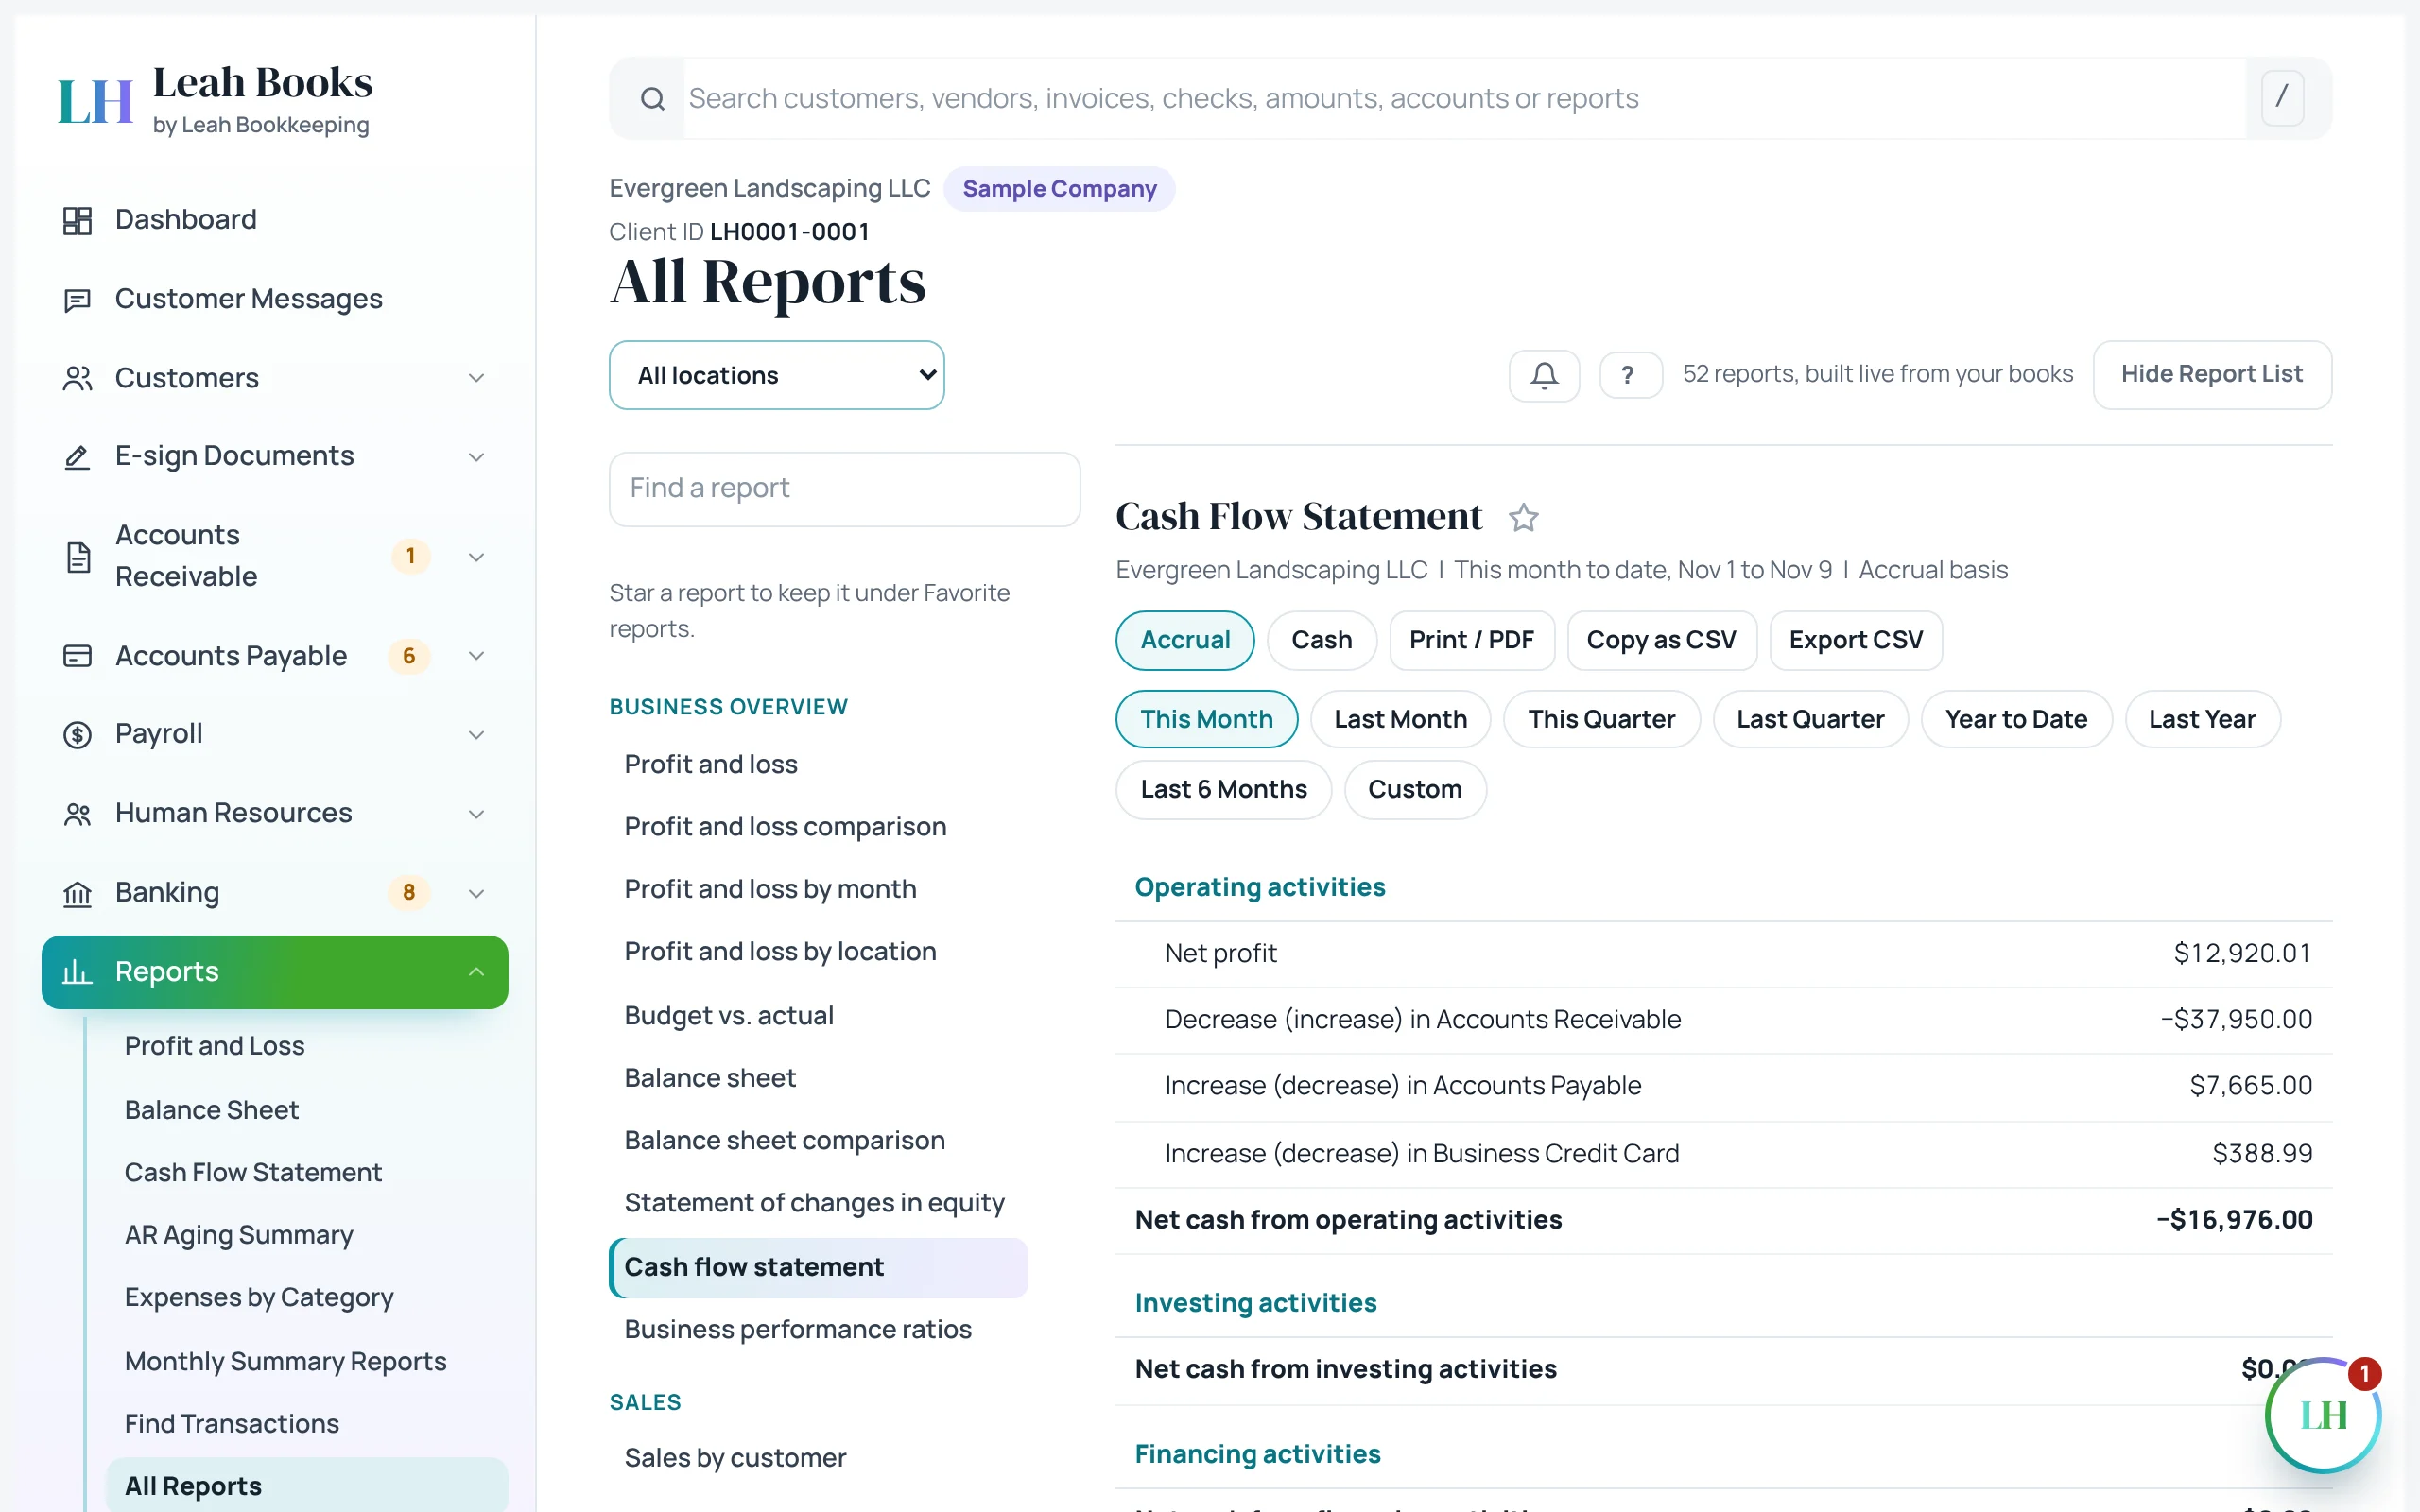 (opens the full-size screenshot)
Try it in Leah Books
- Go to Reports > All reports, then open Business performance ratios.
- Go to Reports > Balance sheet and recalculate the current ratio yourself: Total current assets ÷ Total current liabilities.
- Go to Reports > Profit and loss, choose Last 6 months and compute gross margin and net margin.
- Open Reports > AR aging summary and see which customers' unpaid invoices are pushing days sales outstanding up.
Key terms
- Current ratio
- Current assets divided by current liabilities.
- Quick ratio
- Cash, short-term investments and receivables divided by current liabilities.
- Return on assets (ROA)
- Net income divided by average total assets.
- Return on equity (ROE)
- Net income divided by average equity.
- Accounts receivable turnover
- Net credit sales divided by average accounts receivable.
- Days sales outstanding (DSO)
- The average number of days it takes to collect a receivable.
- Inventory turnover
- Cost of goods sold divided by average inventory.
- Debt-to-equity ratio
- Total liabilities divided by total equity; a measure of leverage.
Check what you learned
Pick an answer to see if it's right and why. Nothing is saved or sent.